Projects
Here you’ll find a mixture of professional E2E SaaS solutions and demos. The technologies I’ve used are highlighted. There are four main categories:
- Machine Learning & AI
- Continuous Integration & Deployment (CI/CD)
- Data Visualisation & Reporting
- Data Strategy
- Other Devs
Click on each thumbnail or title for reports and details.
Machine Learning & AI
SCADA-Based Reliability Assessment of Wind Turbines
In this project, I evaluated the performance and reliability of Senvion MM92 turbines at the Kelmarsh Wind Farm using over 385,000 SCADA event records sourced from Power Factors. The data was transformed into a context-rich dataset to support forecasting and risk analysis for renewable energy systems. By leveraging Monte Carlo simulation and open-source tools, the project showcases how stochastic and data-driven methods uncover valuable insights in wind turbine fleet performance, paving the way for smarter, more resilient energy systems through predictive maintenance.
Keywords: Data Analytics, Risk Assessment, Stochastic Processes, Monte Carlo Simulation.
Advanced regression techniques with Visual Analytics
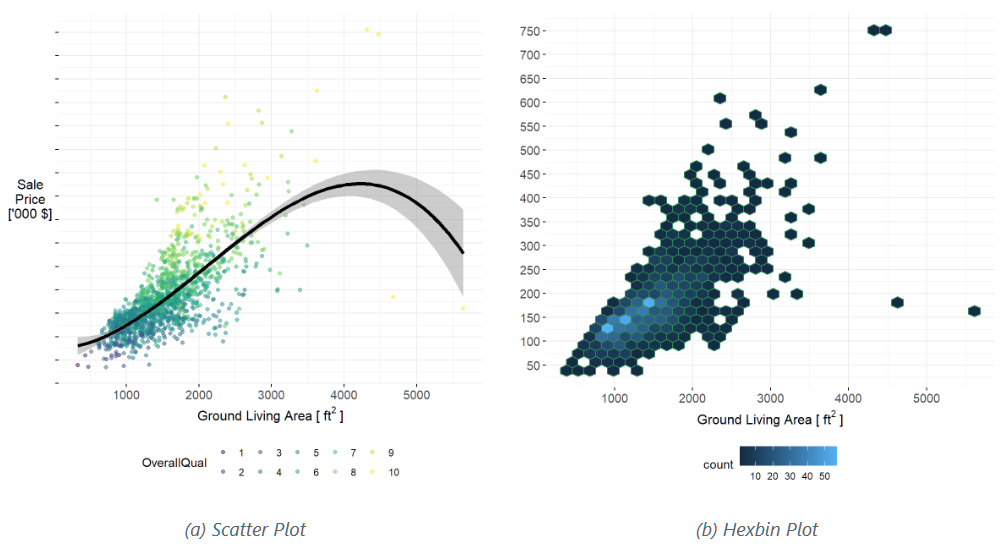
In this demo project, follow my workflow for a top 10% solution for this open Kaggle competition, predicting the house prices in Ames. I’ll give you tips along the way, developing pipelines on the ETL phase, as well as a clean presentation on the EDA supported on the best visuals. I used R with the state-of-the-art Tidyverse and Tidymodels metapackages. Quarto is the publishing system.
Keywords: Machine Learning, Supervised Learning, Regression, Elastic-Net, XGBoost, Ensemble Models.
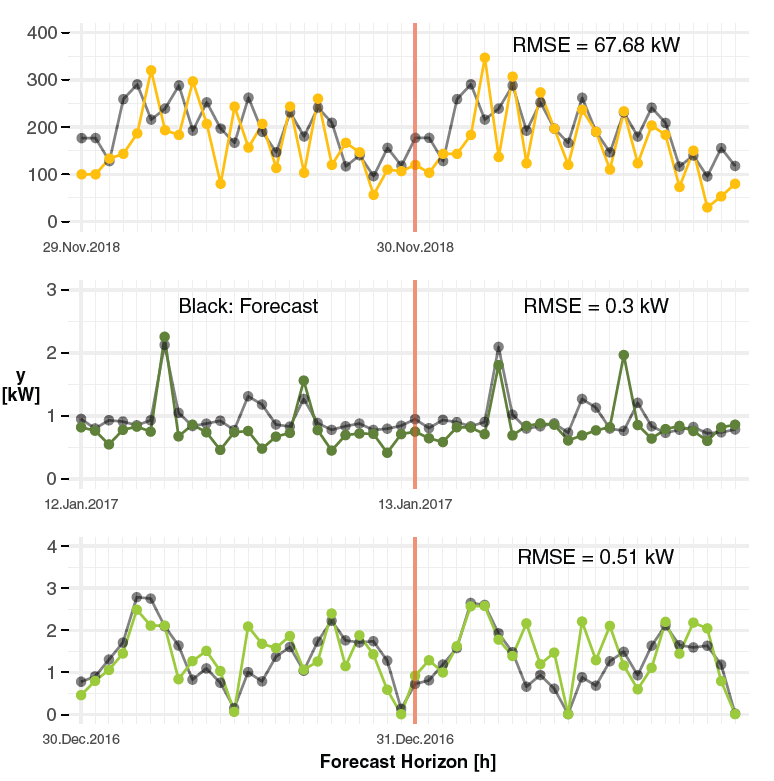
Forecasting heat demand in buildings
With today’s advances on remote sensing, optimal energy management can be performed in the cloud. This is the maxima of project dynOpt-En, where I developed the two-days-ahead forecasting module for the MPC optimiser. Training a Generalised Additive Model (GAM) and using the Dark Sky API, free at that time, I manage to retrieve the weather variables from Numeric Weather Prediction models (NWP) needed as features.
Keywords: Machine Learning, Supervised Learning, Time-Series, Forecasting, GAM.
Water demand prediction with LSTMs for pumps control
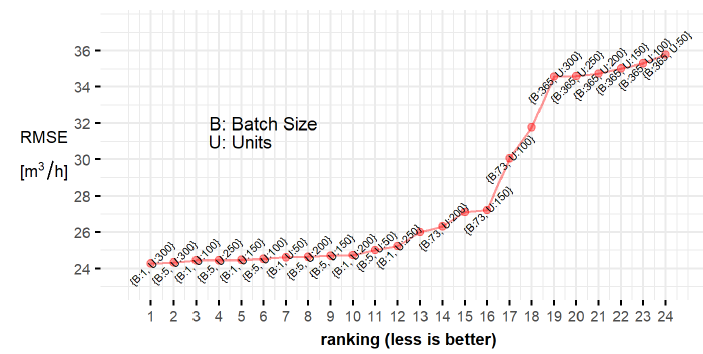
In this project my main task was the hyper-parameters optimisation. Using Python’s scikit-learn and TensorFlow wrapped in the Keras API, I was able to determine the optimal batch size and the number of units for the LSTM network.
Keywords: Deep Learning, Supervised Learning, Time-Series, Forecasting, LSTMs.
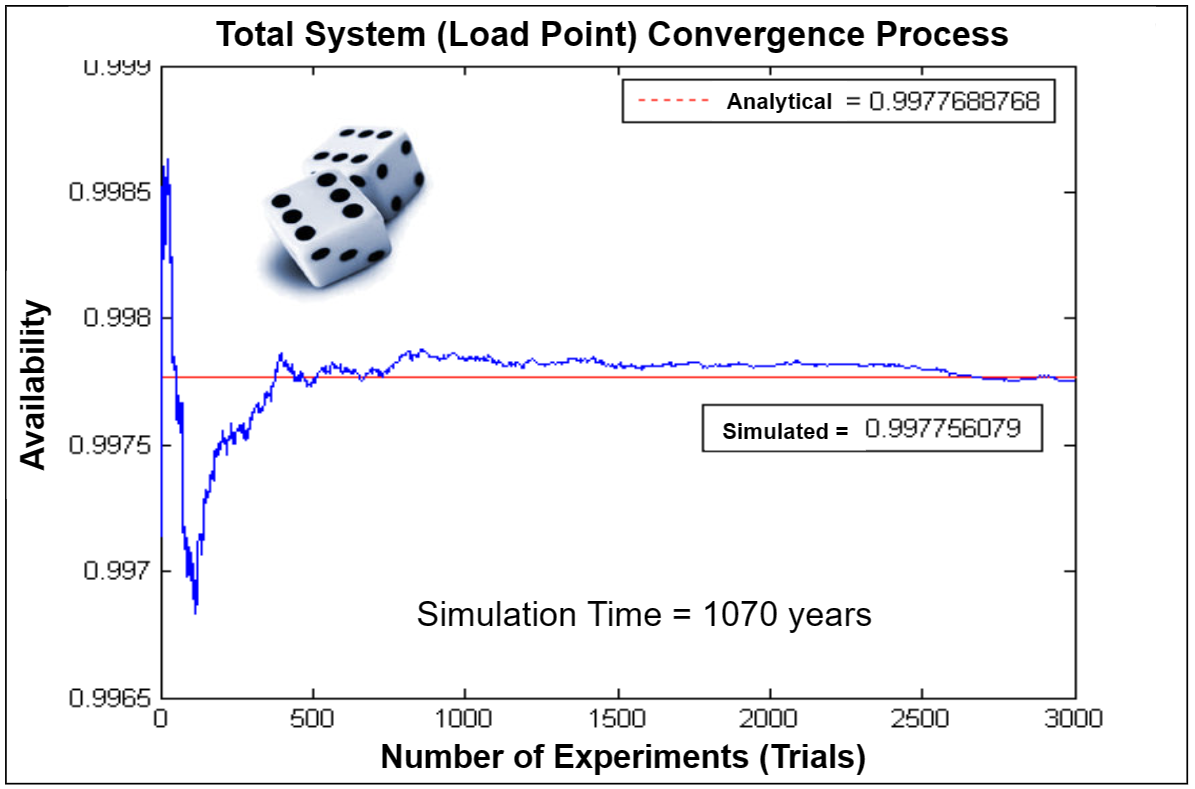
Substation reliability assessment using Monte Carlo methods: Real Case Evaluation
With 4.5/5 ⭐ review score, the almost 20 years-old Matlab code, which is a simplified version of the full project, has helped more than 3000 practitioners and students. I used the Monte Carlo Chronological Technique to simulate an artificial history of failures of the components of power substations, estimating load point stochastic KPIs like Estimated Energy Not Supplied (EENS) and Estimated Duration of Load Curtailment (EDLC).
Keywords: Survival Analysis, Risk, Stochastic Processes, Markov Chains, Monte Carlo Simulation, Business Intelligence.
Hierarchical clustering of daily load profiles
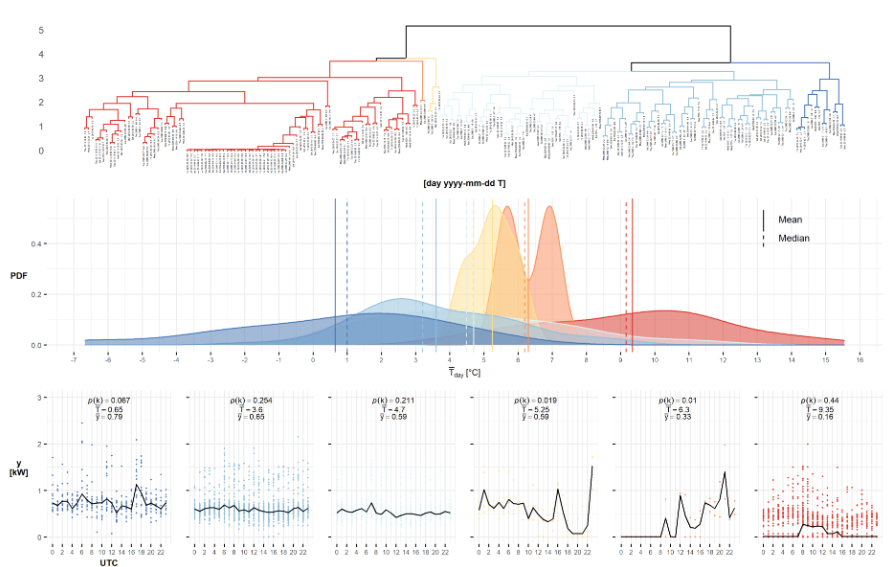
In the modern world of sector-coupled utilities, time-series always have a very strong daily seasonality. Sequential data of demand are a strong function of calendar factors like hour and day type. Based on a proceeding with more than fourty patents, I developed this hierarchical clustering algorithm as a tool to identify the most relevant daily patterns, e.g., weekends, holidays, workdays and anomalous load profiles.
Keywords: Machine Learning, Unsupervised Learning, Classification, Time-Series, Patterns.
CI/CD
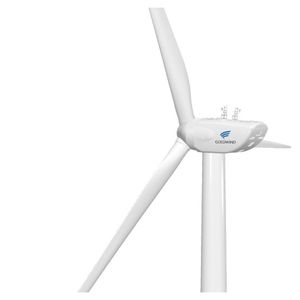
Live Wind Energy Yield Assessment (EYA)
This project showcases the continuous delivery with free tools (Docker & Github Actions) of a short-term power forecast with the theoretical energy yield of a Goldwind turbine. I programmed backend (Python) and frontend (R, Quarto). As a demo, the wind turbine is located on the German coast of the North Sea. Basically, weather variables are obtained from the the DWD-ICON model and these are used as inputs to calculate the theoretical wind power generated using all wind turbine attributes. The Forecast Horizon (FH) is seven days ahead. Hourly predictions are automatically updated daily and the dashboard is refreshed.
Keywords: Docker, GitHub Actions, CI/CD, Forecasting, Numeric Weather Prediction, Time-Series, Energy.
Visualisation & Reporting
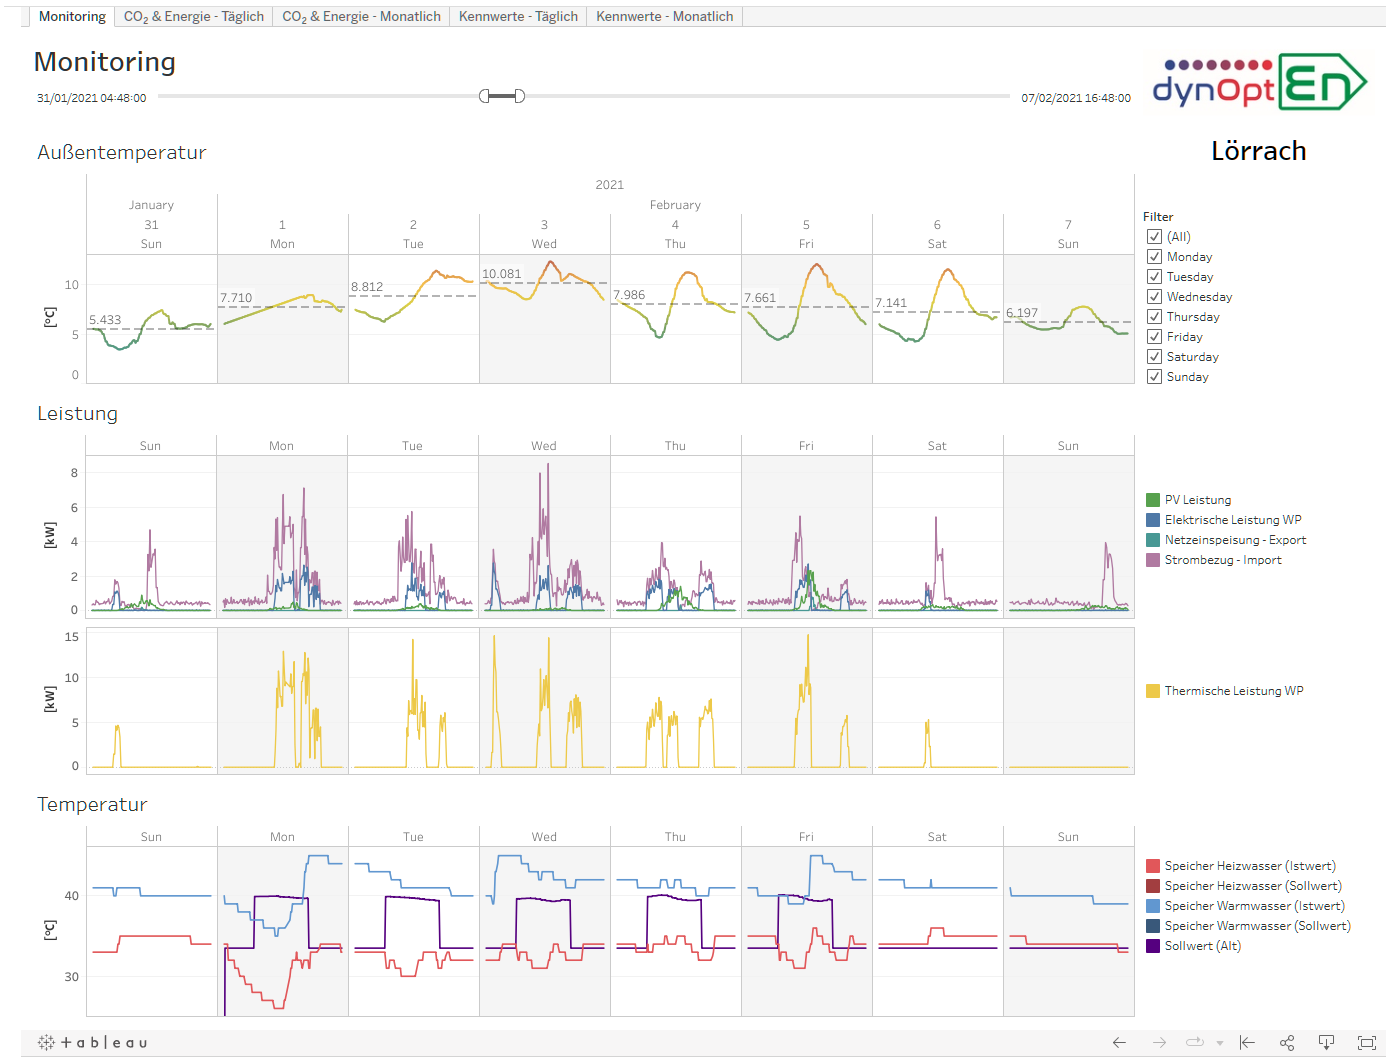
IoT-Dashboards for energy management
I designed these IoT-Dashboards with monitoring and BI purposes using Tableau Desktop. I also developed the whole E2E pipeline using technologies like InfluxDB, SQLite, Python and Tableau Bridge to keep the dashboards up to date on a half-hour basis. This was the final part of the project dynOpt-En.
Keywords: Data Engineering, Tableau, Dashboards, Monitoring, IoT, Energy Management.
E2E monthly energy reports for smart buildings
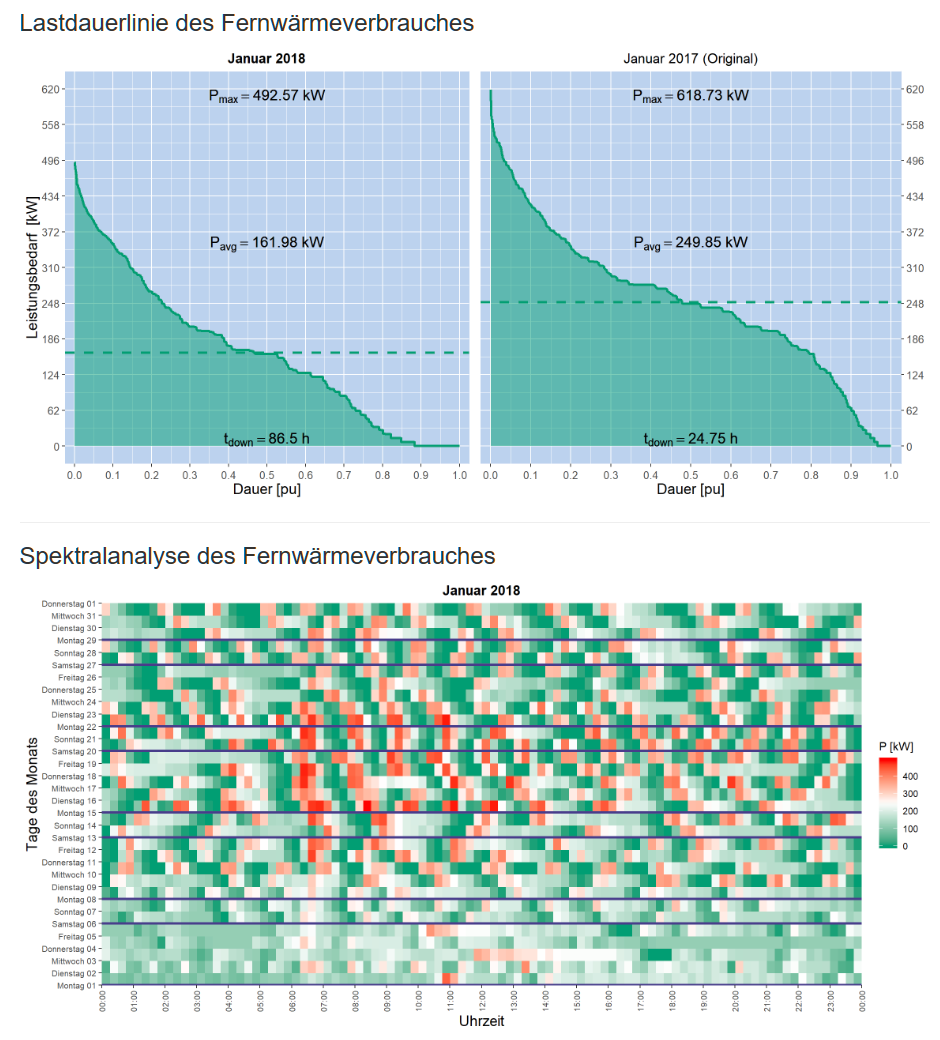
In 2019 for the EffMon project, I developed a set of functions to communicate with Fraunhofer’s FROST-Server, an Open Source implementation of the OGC SensorThings API. Using Markdown publishing technologies, as well as libraries like ggplot, I automatised the entire KPI calculations and visualisations for reporting and management of the entire energy demand of the Fraunhofer IOSB building in Karlsruhe, including district heating, hot water, cooling tower and power. Click on the image to see a video of the results.
Keywords: Asset Management, Data Analysis, Reports Automation, Monitoring.
Data Strategy
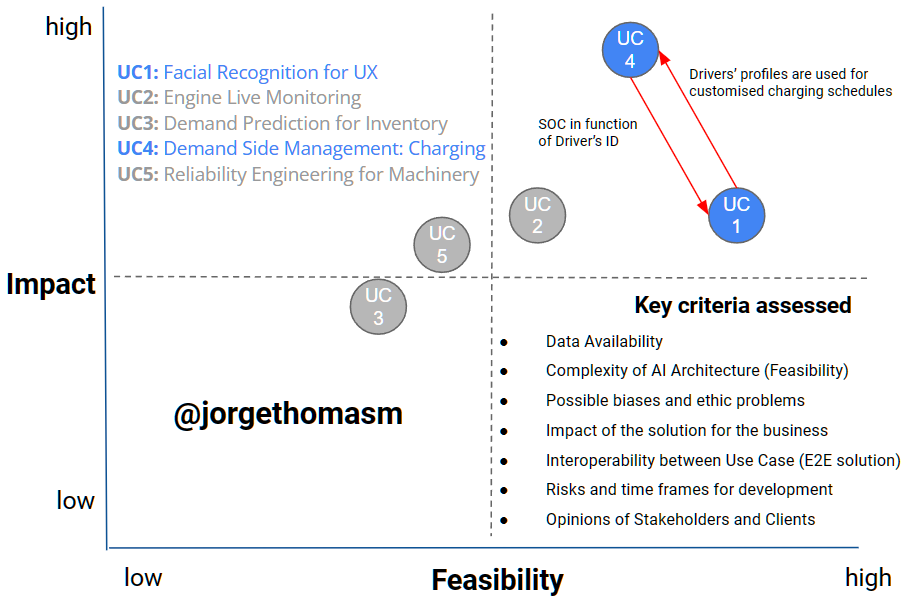
Delivering an ML/AI strategy
“We have a data lake; what can we do?” I developed this demo project with the objective of thoroughly learning a methodology to assess impactful AI implementations in real business projects (Use Cases). I used tools like Storyboards, Prioritisation Grids, 5 V’s Framework and Potter’s Boxes, all this within a ship & iterate philosophy in order to gather quick feedback.
Keywords: AI for Business, AI Architecture, Data Strategy, Data Products.
Other Devs
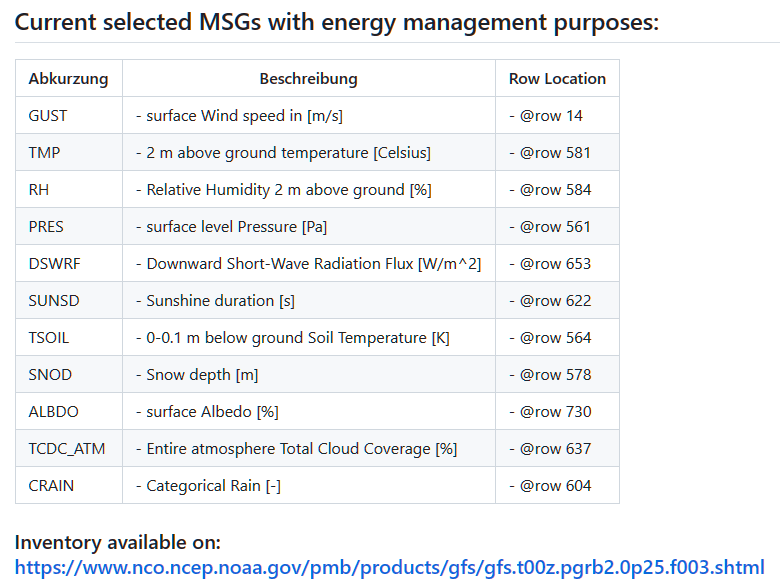
Global Forecast System decoder
I wrote this application in .NET C#. It scraps the ftp-site of NCEP’s Global Forecast System, GFS - Numeric Weather Prediction model (NWP). It also decodes (degribs) and disaggregates the weather forecast variables of any configured pair of geographical coordinates.
Keywords: Software Development, Weather Data, Photovoltaic Power Forecasting.